
Total Clarity for every drop.
The all-in-one platform to measure, manage, and perfect your water. Balance your pool, find the perfect drinking filter, or manage your service clients with zero guesswork.
Wherever the water comes from.
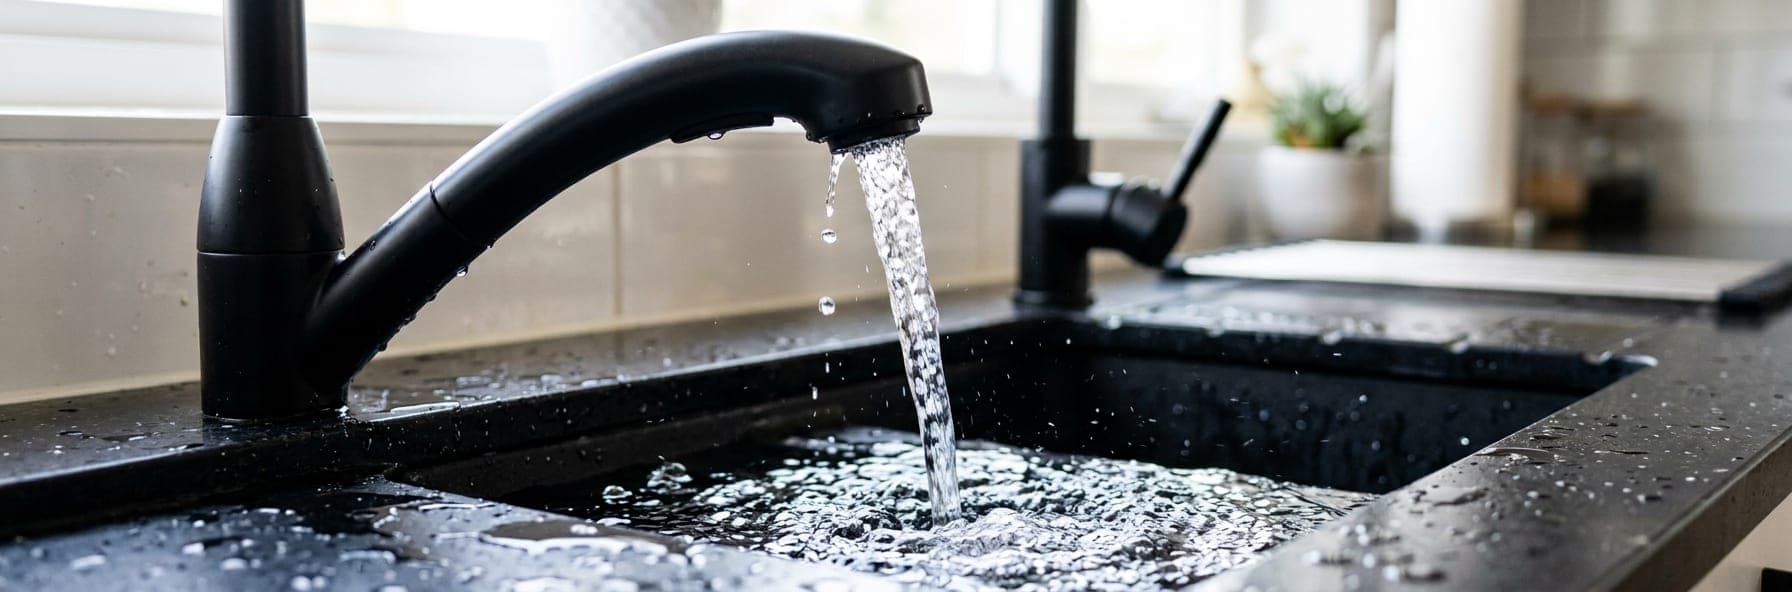
Tap, filter, coffee machine, pool: each one gets its own record, held to the same benchmarks.
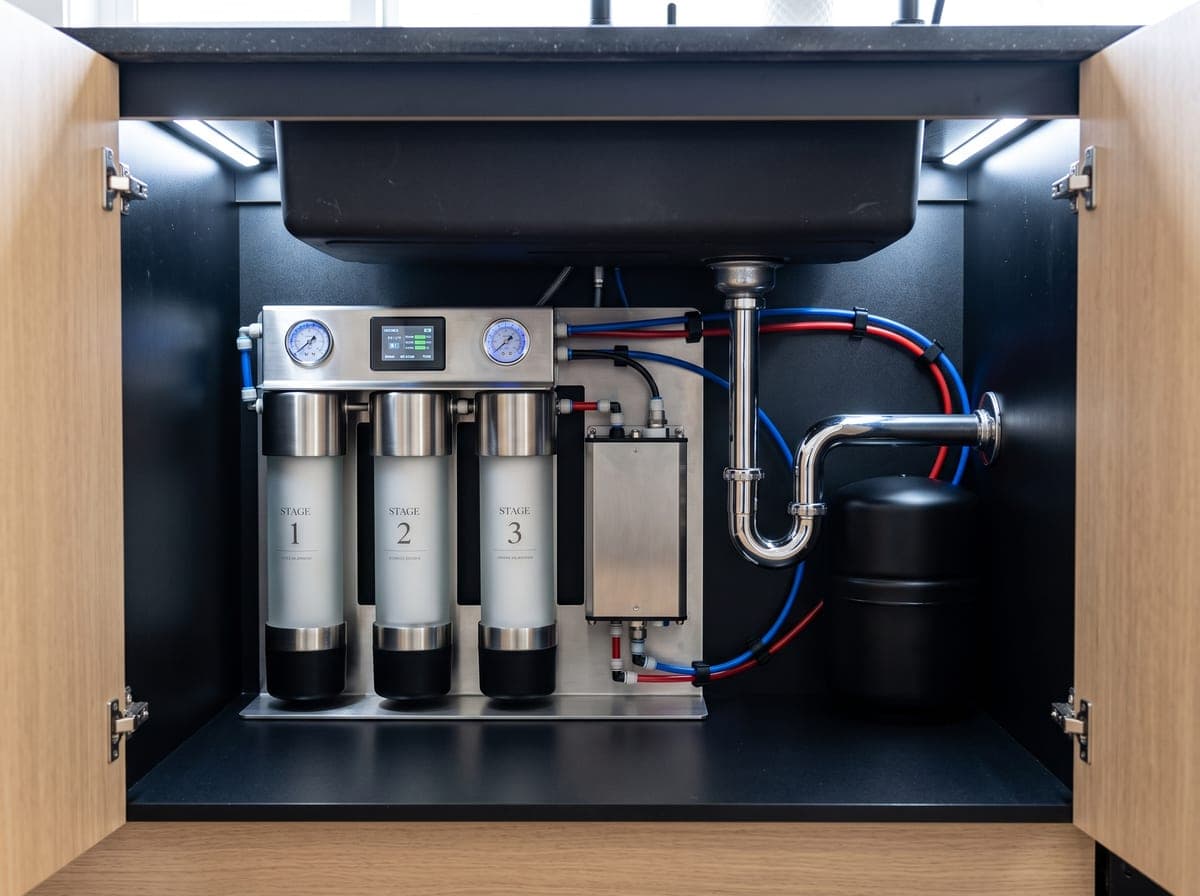
Before and after the filter.
Log the same parameters on both sides and see exactly what the filter is removing.
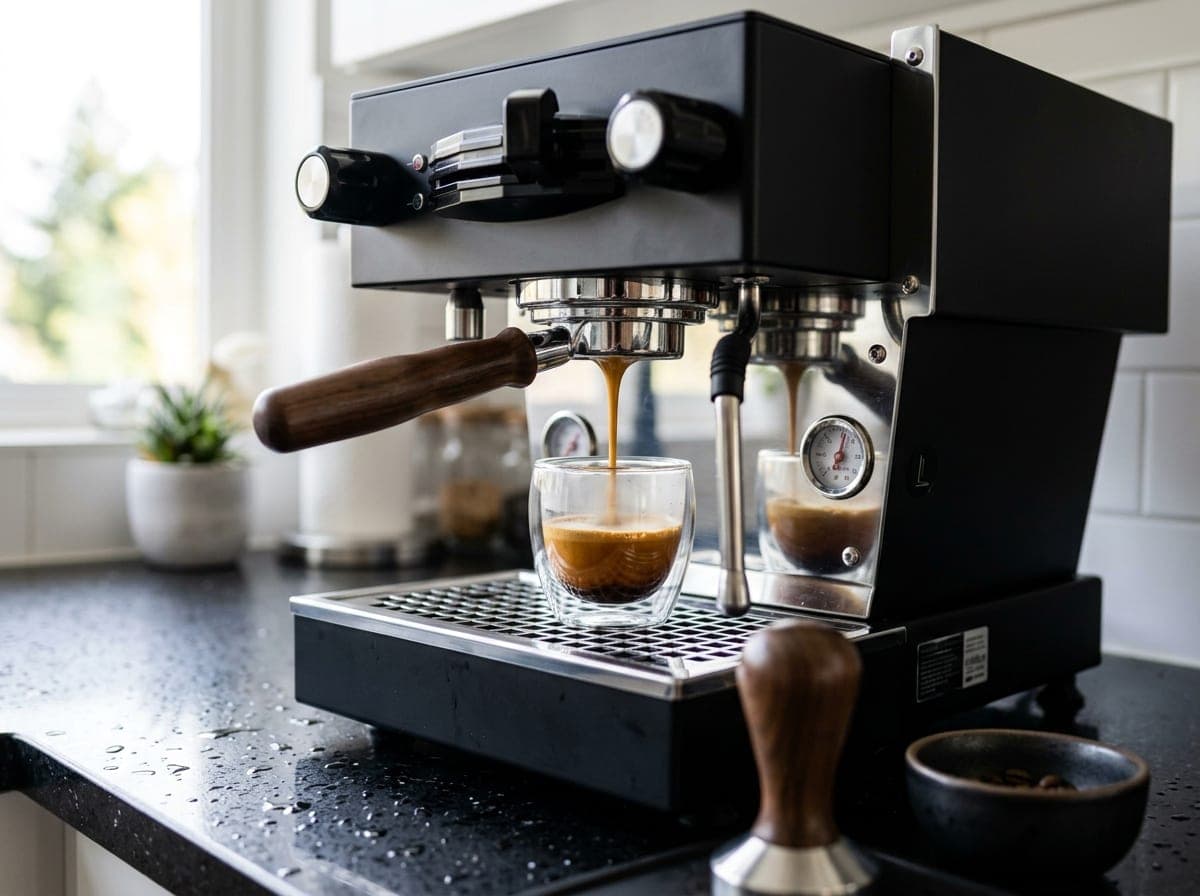
Coffee & espresso machines
Filtered water cuts scale buildup and improves extraction: better taste, and a machine that lasts longer.
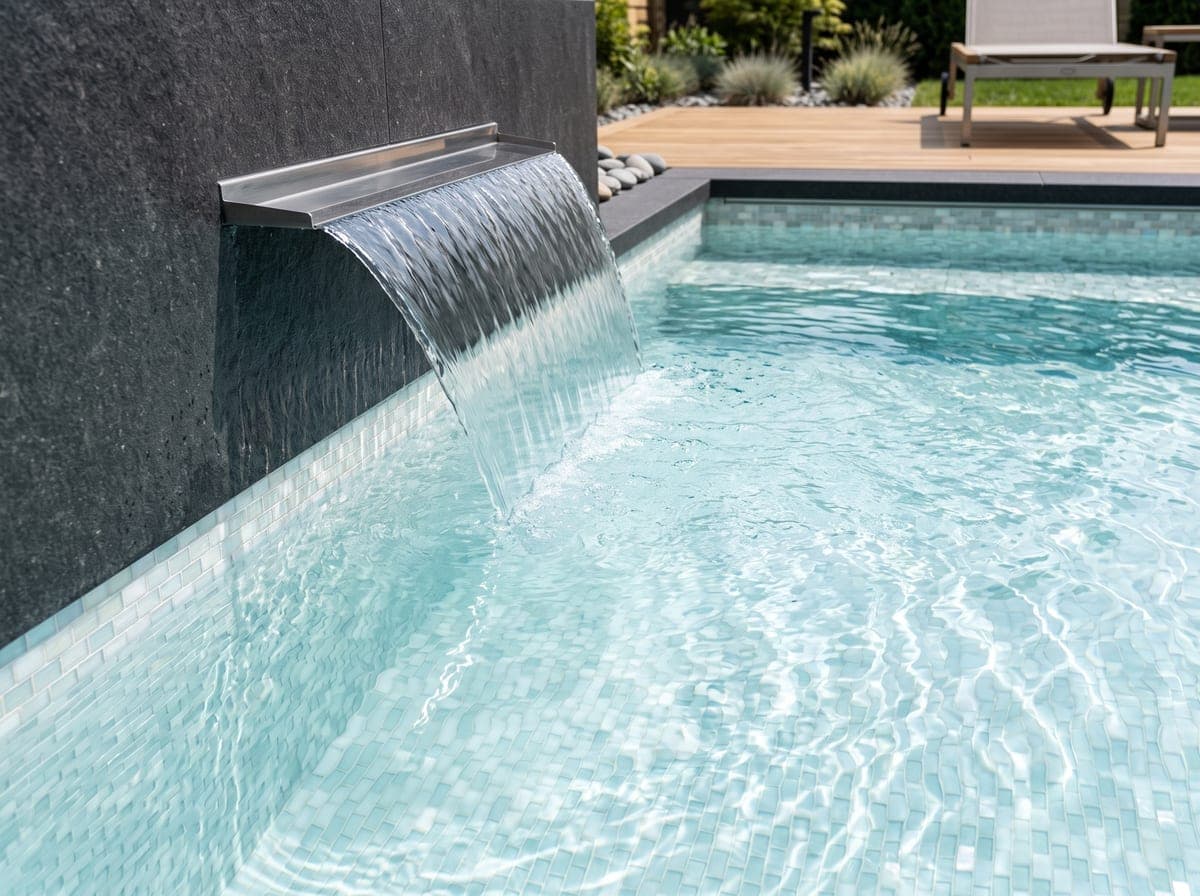
Dosing sized to your pool.
pH, chlorine and alkalinity tracked over the season, with amounts calculated from your volume.
- Sources tracked
- 6
- Chlorine · tap
- 0.9mg/L
- Lead · unfiltered
- 0.004mg/L
- Pool pH
- 7.9pH
Your log · 41 tests · kitchen tap
Chlorine at the kitchen tap, twelve months.
The shaded band is the ideal range. Two readings sat above it in February, both after a main break three streets over; the dosing note you logged that week is attached to each one.
For Homeowners
Take control of your home's water quality with personalized insights.
- Custom filter recommendations based on local tap chemistry.
- Step-by-step chemical dosing for backyard pools.
- Maintenance reminders and easy part ordering.
For Service Pros
Manage your routes, clients, and inventory from one dashboard.
- Every customer's water history, judged against published standards.
- A daily route of what's due, and visit reports with photos.
- Statements and invoices for the work you logged. Free for now.